A trader loses $400 on a swing trade after the free chart shows delayed data during a fast reversal. That gap between what a chart shows and what’s actually happening. This is why the best charting software for technical analysis matters more than most traders admit.
TradingView leads for most traders. TC2000 wins on speed and screening. StockCharts suits weekly and monthly trend work. MetaStock leads on indicator depth.
The right pick depends on how you trade.
Quick Comparison of Best Charting Software for Technical Analysis of Stocks
Here are the top charting platforms for stocks’ technical analysis in 2026:
| Software | Best for | Starting price | Free plan | Key charting strength |
|---|---|---|---|---|
| TradingView | Overall technical charting | $12.95/mo | Yes | 100+ indicators, 90+ drawing tools, Pine Script |
| TrendSpider | Automated pattern detection | $33/mo | No | Auto trendlines, 40+ candlestick patterns |
| TC2000 | Fast scanning and screening | $9.99/mo | Yes (delayed data) | EasyScan screener, custom layouts |
| StockCharts | Classic long-term technical charts | $14.95/mo | Yes | SharpCharts, Point & Figure, seasonality charts |
| MetaStock | Deep indicator libraries and forecasting | $59/mo | No | 300+ indicators, Forecaster pattern engine |
| Stock Rover | Fundamentals plus basic technicals | $7.99/mo | No | 700+ financial metrics, valuation charts |
| Finviz | Visual screening and heatmaps | $39.50/mo | Yes (limited) | Heatmaps, 67 screener filters |
| Koyfin | Multi-asset technical and macro charting | $39/mo | Yes | Cross-asset charts, data transformations |
| thinkorswim | Free technical analysis | Free | Yes | 28-chart grid, risk analysis tools |
| Interactive Brokers TWS | Broker-connected charting | Free with account | Yes | 120+ indicators, hot key trading |
| NinjaTrader | Futures and day trading automation | Free (charting) | Yes | Order flow, volumetric bars, market depth |
| Webull | Mobile charting | Free | Yes | Streamlined mobile interface, after-hours charts |
What are The 12 Best Charting Software For Technical Analysis of Stocks in 2026
TradingView, best overall charting software for technical analysis of stocks
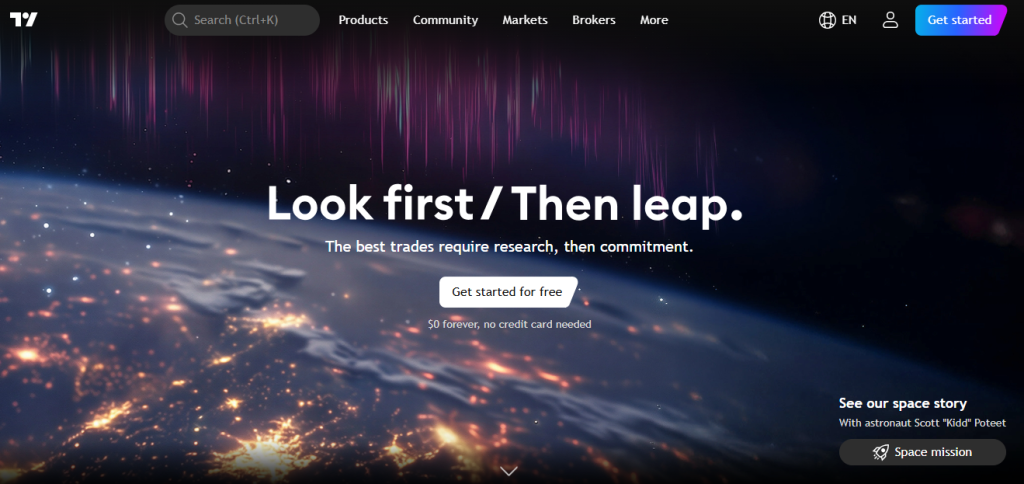
TradingView is a web-based charting platform for stocks’ technical analysis with a large community layer built in. Anyone can share chart layouts, publish custom indicators, or comment on live setups.
Best for: traders who want the deepest indicator library and the most active community, without installing anything.
Key charting features:
- 100+ built-in indicators plus 100,000+ community-built scripts
- 90+ drawing tools across 14 chart types
- Pine Script for custom indicators and strategies
- Multi-chart layouts (up to 16 per tab on the top plan)
- Fundamental data overlays on price charts
- Bar replay for practicing on historical data
Pricing:
Free Basic plan with 1 chart per tab and limited indicators. Paid tiers start at Essential ($12.95/mo billed annually) and go up to Ultimate ($199.95/mo billed annually).
Every paid plan includes a 30-day free trial.
Limitations:
Real-time data for US stock exchanges usually needs a separate paid data add-on.
The interface gets crowded once you start layering indicators, and new users often need a week or two just to find their way around the settings.
TrendSpider, best charting software for automated pattern detection
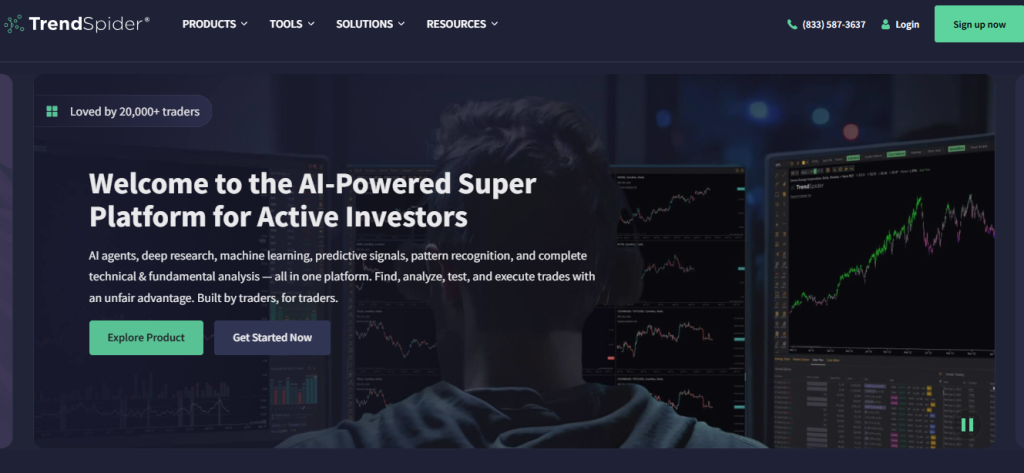
TrendSpider builds its charting around automation. Instead of drawing trendlines by hand, the software detects them, along with candlestick patterns and support and resistance levels.
Best for: traders who want pattern recognition and backtesting done for them, not by hand.
Key charting features:
- Automated trendline detection with backtested success rates
- Candlestick pattern recognition across 40+ patterns
- No-code strategy tester for backtesting setups
- Dynamic price alerts tied to chart patterns, not just price levels
- AI Sidekick for building and troubleshooting custom indicators
- Trading bots for automating strategies once tested
Pricing:
No free plan.
Standard starts at $54/mo billed annually, Premium at $91/mo, Enhanced at $122/mo.
The trial itself is paid too, $19 for 14 days of full access on Standard.
Limitations:
The learning curve runs 2 to 4 weeks for most users before the automation actually saves time instead of adding confusion. It’s also a real jump in price from something like TradingView’s mid-tier.
TC2000, best charting software for fast scanning and screening
TC2000 comes from Worden Brothers, the company behind the original TeleChart software from 1988. It’s built around one job: flipping through charts and filtering watchlists fast.
Best for: stock and options traders who scan for setups using advanced stock screeners constantly and need the results to render without delay..
Key charting features:
- EasyScan real-time screener with formula-based (PCF) custom scans
- Customizable, saveable multi-monitor layouts
- Drag-to-preview drawing tools for trendlines and AVWAP
- Live US equity data (NYSE, Nasdaq, AMEX) via Nasdaq Basic, bundled into every paid plan
- Standard indicator library: moving averages, oscillators, volume studies
- Journal feature that tracks win rate and P&L by symbol
Options-focused traders may also want to compare platforms built for options analysis and trading when choosing their broader toolkit.
Pricing:
Free Silver Basic tier with 20-minute delayed data and no scanning.
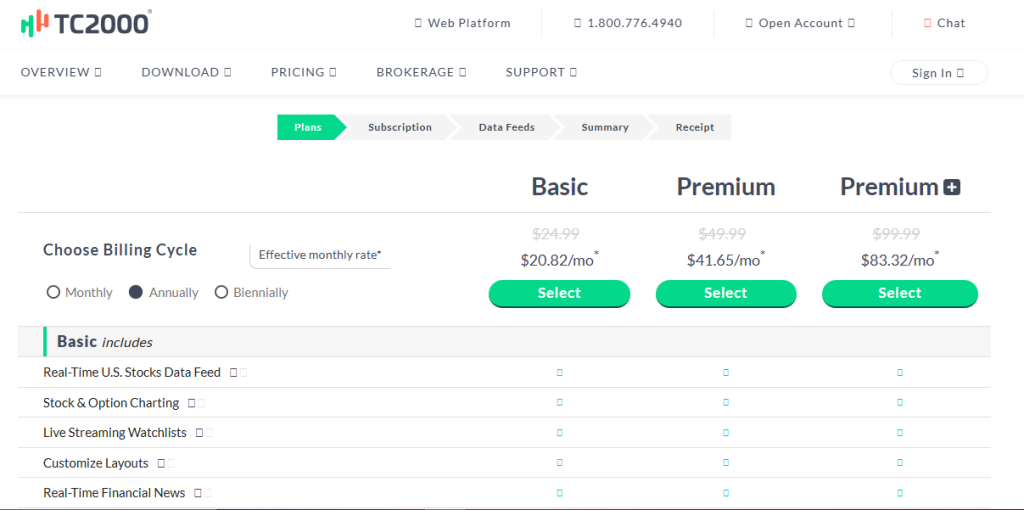
Paid tiers: Silver $9.99/mo (adds scanning, delayed data), Gold $24.99/mo, Premium $49.99/mo, Premium+ $99.99/mo.
Real-time data is included on paid plans, not sold separately.
Limitations:
It covers stocks and options only, no forex, futures, or crypto. There’s no backtesting built in either, so if that matters to your process, you’ll need a second tool alongside it.
StockCharts, best platform for classic long-term technical stock charting
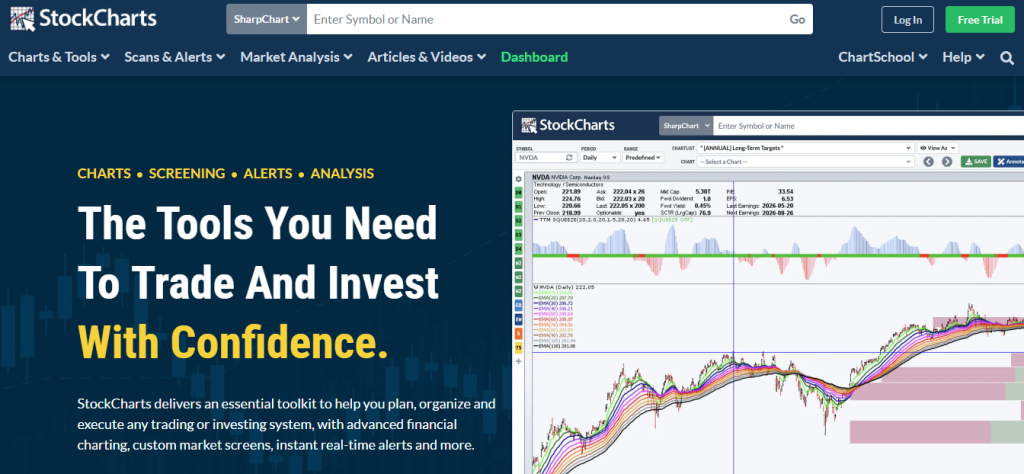
StockCharts has been around since the late 1990s and still runs on a philosophy of simplicity. Its SharpCharts and ACP platforms cover the standard technical toolkit without trying to be everything at once.
Best for: swing traders and longer-term investors who want clean, classic chart types without a steep setup process.
Key charting features:
- PerfCharts, which overlay up to 10 tickers on one chart
- Point & Figure charts for filtering out micro price moves
- Seasonality charts for spotting patterns across timeframes
- Custom scans running on daily, weekly, or monthly bars
- Historical chart data back to 1900 on the PRO plan
- ChartSchool, a free technical analysis education library
Pricing:
Free tier available.
Paid: Basic $19.95/mo, Extra $29.95/mo, PRO $49.95/mo.
A 1-month free trial is included, and annual billing gets you a 13th month free.
Limitations:
Charts auto-refresh on a 5 to 15 second delay rather than updating live tick by tick, so it’s a weaker fit for day trading.
Free real-time US data is included via BATS, but full real-time coverage for other markets costs an added $9.95/mo.
MetaStock, best charting platform for deep indicator libraries and forecasting
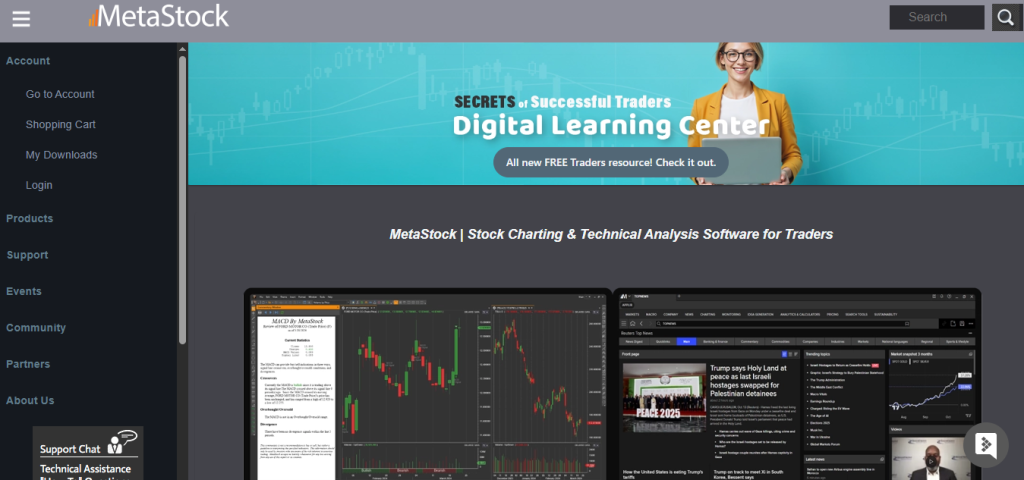
MetaStock has been in the technical analysis business since 1982, when Steve Achelis first built it to run on a PC. It’s now partnered with Refinitiv (Thomson Reuters) for data and news.
Best for: traders who want the widest indicator library available and built-in forecasting tools, and who don’t mind paying for depth.
Key charting features:
- 300+ price and volume indicators, including Gann, Fibonacci, and Ichimoku Cloud
- Forecaster module with 110 pattern recognizers for projecting price moves
- Point & Figure, Equivolume, and Market Profile chart types
- Custom indicator coding, with support available if you don’t code
- Marketplace for buying pre-built trading systems and signals
- Runs locally, so it works offline as well as online
Pricing:
MetaStock R/T (real-time) starts around $59/mo for the base package. Adding Xenith real-time news and data pushes the top package to roughly $265/mo.
One-time license purchases are also available if you’d rather avoid monthly billing.
Limitations:
The price gap between the entry tier and the full real-time news package is steep. The interface also shows its age. It’s a Windows-style desktop app at heart, and newer traders may find the sheer number of add-ons hard to track.
Stock Rover, best charting software for combining fundamentals with basic technicals
Stock Rover leans toward research rather than active trading. It’s built for people who want to hold positions and track portfolios over years, not minutes.
Best for: long-term investors who want financial statement data and technical charts in the same place.
Key charting features:
- Up to 700+ financial metrics on the Premium Plus plan
- 4 valuation charts for comparing investments from different angles
- Adjustable benchmark comparisons against the S&P 500, an ETF, or another portfolio
- Basic technical indicators layered onto fundamental charts
- Automated portfolio reports and rebalancing support
- Integration with 100+ brokers
Pricing:
No free charting.
Essentials starts at $7.99/mo, Premium and Premium Plus scale up from there, Ultimate reaches $199/mo. Multi-year plans knock up to 40% off.
Limitations:
It’s built for research depth, not speed. If you’re looking for real-time technical signals for day trading, this isn’t the tool, and the learning curve for new users is real given how many metrics are on offer.
Finviz, best charting platform for visual screening and heatmaps
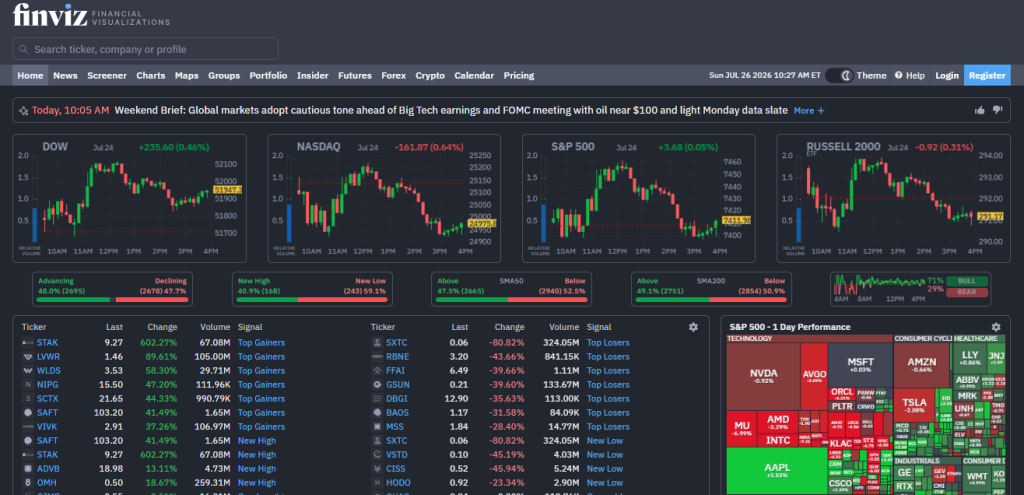
Finviz has looked more or less the same since it launched in 2007. Behind that plain interface sits a fast, flexible stock screener.
Best for: traders who want to spot setups visually through heatmaps and screener filters rather than scrolling individual charts.
Key charting features:
- 67 descriptive, technical, and fundamental screener filters
- Market heatmaps and correlation views
- 13 different viewing options for a stock screen
- Real-time pricing and intraday charts on Elite
- Chart templates and saved screens
- US stock coverage with fast-loading pages
Pricing:
Free tier with delayed data and limited charting. Elite is $39.50/mo, or $24.96/mo billed annually.
Limitations:
Most of the useful charting features sit behind Elite, the free tier alone won’t get you far. Coverage is also mostly US-focused, so it’s a weak fit if you trade international markets.
Koyfin, best software for multi-asset technical and macro charting
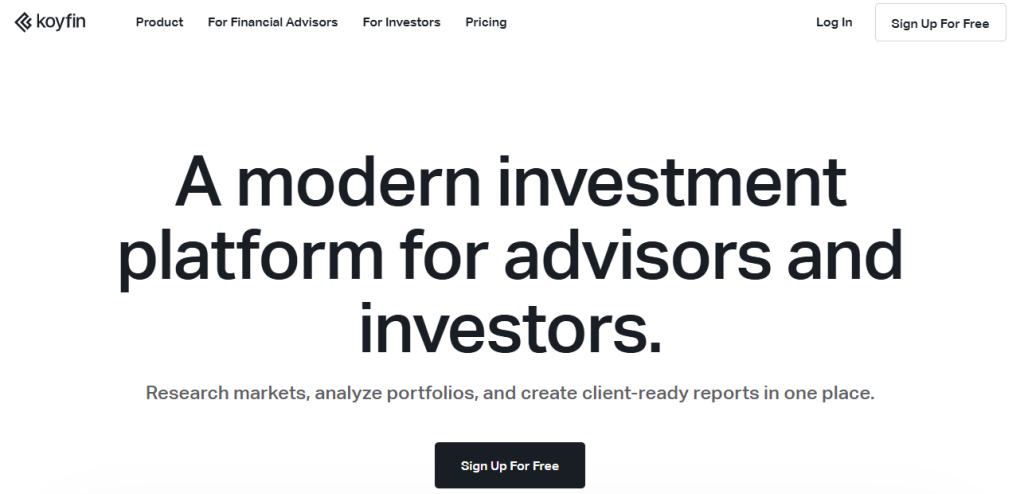
Koyfin combines technical charts with macro data and fundamentals in one platform, aimed at cutting down on how many market research tools you need open at once.
Best for: investors and advisors who want technical charts alongside macro context like interest rates and yield curves, not just price action.
Key charting features:
- Cross-asset charts overlaying equities, FX, futures, and macro series
- Data transformations: growth rate, drawdowns, rate of change
- Relative charts for comparing performance or relative strength between two series
- ETF valuation charting (P/E, P/S, EV/EBIT, yields)
- Chart templates that carry over across tickers
- Coverage of 100,000+ global stocks
Pricing:
Advanced charting is available free. Paid plans start at $39/mo and add extended financial data and unlimited templates.
Limitations:
No minute-level intraday candles, and pricing for stocks outside the US and Canada is end-of-day only, not real-time. Options data isn’t covered either.
thinkorswim, best free technical analysis charting platform
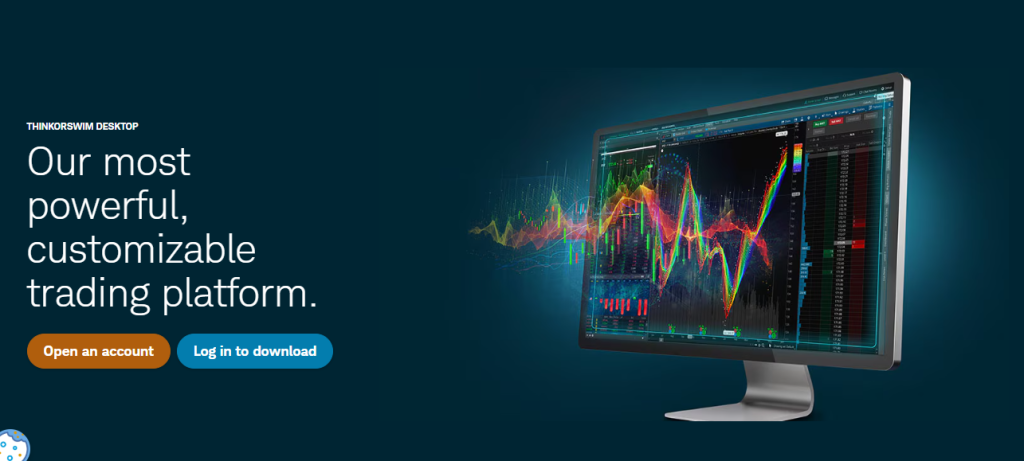
thinkorswim moved from TD Ameritrade to Charles Schwab after the 2023 acquisition completed. It’s still actively developed under Schwab.
In 2026 Schwab added 24/7 crypto futures trading to the platform, alongside its existing charting and options tools.
Best for: traders who want a full-featured charting platform for free, tied to a no-minimum brokerage account.
Key charting features:
- Configurable chart grid, up to 28 charts across custom layouts
- Analyze tab for pulling up risk graphs on potential trades
- paperMoney simulated trading with $100,000 in virtual funds
- Customizable trade buttons and add-on “super gadgets”
- Options-focused charting tools, including probability analysis
- Available on desktop, web, and mobile
Pricing:
Free with a Schwab brokerage account, no minimum deposit.
Limitations:
The interface carries over a lot of its TD Ameritrade-era design, which can feel dated next to newer platforms. It also doesn’t offer a public API for retail traders since the TD Ameritrade API was shut down during the migration.
Interactive Brokers TWS, best for tech-savvy broker-connected charting software
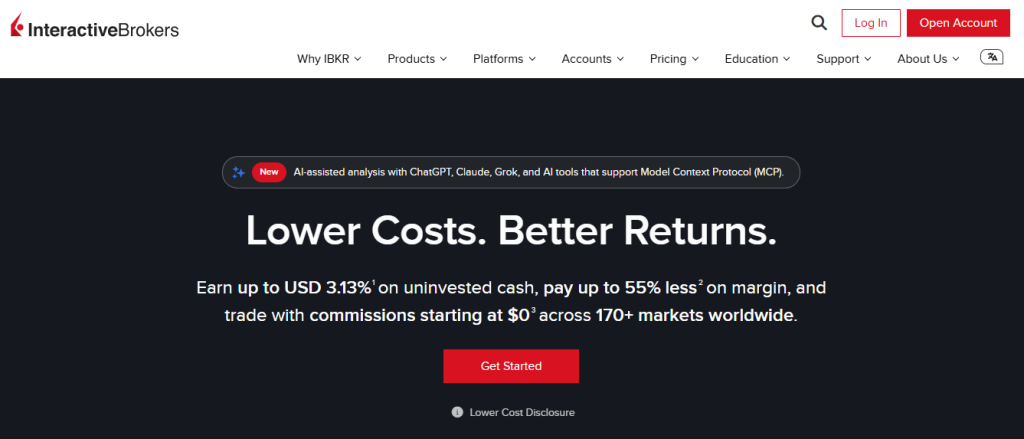
Trader Workstation (TWS) is Interactive Brokers’ flagship desktop platform. This charting platform is built for traders who want charting tied directly to fast order execution across a wide range of markets.
Best for: traders who want charting and execution in the same window, with global market access.
Key charting features:
- 120+ technical indicators and overlays, including less common ones like ADX/DMI and Zigzag
- Hot key trading directly from the chart
- Charting and trading access across stocks, options, futures, currencies, and crypto in 150+ global markets
- TradingView integration for traders who prefer that charting interface
- IBKR GlobalTrader and Impact apps for more casual or ESG-focused access
- Customizable multi-window layouts
Pricing:
Free with an IBKR account.
IBKR Lite charges zero commission on most US stock and ETF trades.
IBKR Pro charges small per-trade commissions in exchange for more control over order routing.
Limitations:
The interface is dense. Most of what makes TWS powerful (order routing control, margin flexibility) is built for traders who already know what they’re doing.
It’s not the easiest starting point if you’ve never used a broker platform before.
NinjaTrader, best charting software for futures and day trading automation
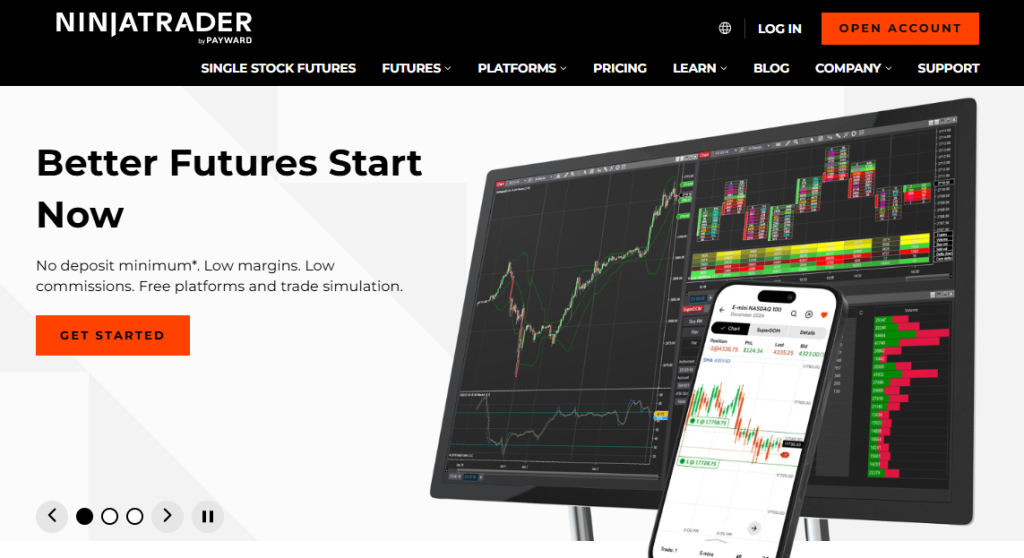
NinjaTrader is built around futures trading and order flow analysis, with charting that’s free regardless of whether you ever fund a live account.
Traders comparing futures-focused setups with other products may also want to evaluate other trading platforms before settling on a long-term solution.
Best for: futures traders who want order flow charting and automation without paying a platform fee.
Key charting features:
- Volume profile and footprint (order-flow style) charting
- SuperDOM, a fast one-click order ladder built for scalping
- Hundreds of indicators plus custom indicator building in C# via NinjaScript
- Market replay for practicing on historical tick data
- Backtesting and automated strategy deployment
- 1,000+ third-party add-ons
Pricing:
Charting, backtesting, and simulated trading are free permanently, no funding required.
Free (higher per-contract commissions, $1.29/side standard, $0.39/side micro), Monthly $99/mo (lower commissions), or Lifetime $1,499 one-time (lowest commissions at $0.59/side standard, $0.09/side micro).
Limitations:
It’s futures-only, so stock and options traders won’t find a use for the brokerage side. It’s also Windows-first, Mac users need a virtual machine or VPS to run it properly.
Webull, best mobile charting app for stock technical analysis
Webull is a mobile-first broker and charting app aimed at traders who want speed and a clean interface over a long feature list.
Best for: traders who do most of their charting and order entry from a phone.
Key charting features:
- Fast-loading mobile charts with after-hours visibility
- Dynamic charting synced across mobile, desktop, and web
- Basic technical indicator library
- Real-time quotes with no separate data fee
- Paper trading for practicing strategies
- Streamlined watchlists and alerts
Pricing:
Free, including real-time data and commission-free stock and ETF trades.
Limitations:
The indicator library is thinner than dedicated charting platforms like TradingView or MetaStock, and there’s no desktop-grade layout customization. It’s built for a younger, mobile-first trader, not someone running multi-monitor setups.
How We Evaluated These Charting Platforms For Technical Analysis
Every pick above is judged against the same 5 criteria.
- Indicator library size. How many built-in indicators and drawing tools ship with the platform, and whether custom or community-built indicators are available on top. TradingView’s 100,000+ community scripts and MetaStock’s 300+ built-in indicators sit at opposite ends of this, one crowdsourced, one vendor-built.
- Automation and pattern recognition. Whether the software draws trendlines and flags patterns for you, or leaves that entirely to the trader. TrendSpider and MetaStock’s Forecaster module are the main automated picks on this list, most others require manual chart reading.
- Data coverage. What’s real-time versus delayed by default, and whether that data costs extra. This varies a lot: NinjaTrader and Webull include real-time data free, while TradingView and StockCharts often require a separate paid data add-on for full real-time coverage.
- Pricing transparency. Whether the vendor publishes exact plan costs or hides them behind a “contact sales” form. Every platform covered here has public, checkable pricing, which is also why the numbers in this guide come with specific dollar figures instead of vague ranges.
- Learning curve. How long it takes a new user to get comfortable, since a platform stacked with features is only useful if you can actually navigate it. TC2000 and Webull sit on the fast end, MetaStock and TrendSpider take real time to learn.
Free vs Paid Tiers of Charting Software For Technical Analysis
| Software | Free tier limits | Cheapest paid plan | Best value plan |
|---|---|---|---|
| TradingView | 1 chart per tab, 2 indicators, delayed data on many exchanges | Essential, $12.95/mo (annual) | Plus, $29.95/mo (annual) |
| TrendSpider | None | Standard, $54/mo (annual) | Premium, $91/mo (annual) |
| TC2000 | Charting and watchlists, 20-minute delayed data, no scanning | Silver, $9.99/mo | Gold, $24.99/mo |
| StockCharts | Basic charting, real-time US data via BATS, limited indicators | Basic, $19.95/mo | Extra, $29.95/mo |
| MetaStock | None | R/T base package, roughly $59/mo | R/T + Xenith, roughly $265/mo |
| Stock Rover | None | Essentials, $7.99/mo | Premium Plus |
| Finviz | Delayed data, limited charting | Elite, $39.50/mo ($24.96/mo annual) | Elite (only paid tier) |
| Koyfin | Advanced charting included | Paid tier, $39/mo | Paid tier, $39/mo (only step up) |
| thinkorswim | Full platform, free with a Schwab account | Free | Free |
| Interactive Brokers TWS | Full platform, free with an IBKR account | Free (IBKR Lite, $0 commission) | IBKR Pro (per-trade commission) |
| NinjaTrader | Charting, backtesting, simulated trading, permanently free | Monthly, $99/mo (lowers per-contract commissions) | Lifetime, $1,499 one-time |
| Webull | Full charting and real-time data, free | Free | Free |
5 of the 12 stock technical analysis tools here cost nothing to chart with:
- thinkorswim, TWS, NinjaTrader, and Webull are free outright,
- TradingView, TC2000, StockCharts, Finviz, and Koyfin all have usable free tiers with limits attached.
- TrendSpider, MetaStock, and Stock Rover charge from day one.
How to Choose The Right Charting Software For Your Strategic Technical Analysis
Swing traders holding positions for days or weeks don’t need real-time data. StockCharts fits that pace well.
Day traders need speed and live data above almost everything else. TC2000’s EasyScan and TrendSpider’s automated pattern detection both solve for that, although they solve different problems. TC2000 gets you into and out of scans fast.
- TrendSpider does the trendline and pattern-drawing work for you. Futures-specific day traders should look at NinjaTrader instead, its order flow charting and SuperDOM are built for that market specifically.
- Long-term investors care less about candlestick patterns and more about how a position looks against a benchmark over years. Stock Rover and Koyfin both fit here.
Stock Rover leans harder into portfolio tracking and valuation charts. Koyfin adds macro data like yield curves into the same view.
Fundamentals-first investors who still want some technical context are best served by Koyfin or Stock Rover, since both chart financial statement data alongside price.
- If budget is the deciding factor and you just want something reliable without a subscription, thinkorswim and Interactive Brokers TWS give you full charting for free, tied to a brokerage account.
Last Word
TradingView is the best charting software for technical analysis of stocks overall. TC2000 is the better technical charting software if scanning speed matters most, and StockCharts or MetaStock cover you if you’re after classic long-term charts or the deepest indicator library available.
FAQs on Best Charting Software for Technical Stock Analysis
Q#1. What is the best charting software for stocks?
TradingView is the best overall pick for most traders, thanks to its indicator library, drawing tools, and free tier. For active stock scanning specifically, TC2000 is the stronger stock technical analysis software, and StockCharts is the better fit if you’re analyzing weekly or monthly trends rather than intraday moves.
Q#2. What is the best free stock charting software?
thinkorswim and Interactive Brokers TWS both give you full charting for free with a brokerage account, no minimum balance required. TradingView, TC2000, StockCharts, Finviz, and Koyfin also offer usable free tiers, though each caps out on indicators, scanning, or real-time data until you upgrade.
Q#3. Is TradingView still the best for technical analysis in 2026?
Yes, for most use cases. It remains the best charting software for stocks by breadth: over 100 built-in indicators, 90+ drawing tools, and a community library of 100,000+ custom scripts nothing else on this list matches. Traders who need automated pattern detection or fast scanning may still prefer TrendSpider or TC2000 for those specific jobs.
Q#4. What charting software do professional day traders use?
Day traders lean toward TC2000 for scan speed, TrendSpider for automated technical analysis, and NinjaTrader for futures-specific order flow charting. Interactive Brokers TWS is also common among traders who want charting and fast order execution in the same window.
Q#5. Can I do technical analysis without paying for software?
Yes. thinkorswim, Interactive Brokers TWS, NinjaTrader, and Webull all offer full charting for free, and TradingView’s free tier covers basic technical analysis with 2 indicators per chart. The tradeoff on free tiers is usually delayed data or limits on how many charts and indicators you can run at once.
Q#6. TC2000 vs TradingView, which is better for charting?
TC2000 wins on scan speed and chart-rendering speed, its EasyScan screener is built for flipping through setups fast. TradingView wins on indicator depth, community scripts, and multi-asset coverage beyond just US stocks and options.
